Last-mile delivery is where customer promises meet operational reality. It is the final movement of an order from a store, fulfillment center, parcel facility or local hub to the customer—and it is often the stage most exposed to traffic, failed delivery attempts, narrow time windows and rapidly changing demand.
This 2026 guide explains how to optimize last-mile delivery using practical KPI formulas, route and dispatch strategies, delivery software and a structured improvement roadmap. The objective is not simply faster delivery. It is a higher first-attempt success rate, dependable on-time performance and a sustainable cost per successful stop.
What Is Last-Mile Delivery?
Last-mile delivery is the final leg of a shipment’s journey to its destination. In e-commerce it usually means delivery to a home, business, pickup point or locker. The “mile” is not a fixed distance: an urban stop may be nearby but time-consuming, while a rural route may cover many miles between customers.
Last-mile operations connect order management, fulfillment, dispatch, drivers, customers and proof of delivery. A delay or data error at any earlier stage can surface during the final delivery window.
Why Last-Mile Delivery Is Difficult
- Fragmented destinations: every order may have a different address, access constraint and service time.
- Demand variability: order volume changes by day, hour, neighborhood, promotion and season.
- Traffic and curb constraints: congestion, parking availability and building access can disrupt otherwise efficient routes.
- Customer availability: missed handoffs and incorrect instructions increase repeat attempts.
- Service promises: same-day and narrow delivery windows reduce routing flexibility.
- Unit economics: small orders, long distances and low route density increase cost per successful delivery.
The U.S. Department of Transportation notes that growing freight demand creates increasing pressure on first- and last-mile movement in urban areas. That makes delivery design a network and city-operating problem—not only a driver-routing problem.
How the Last-Mile Delivery Process Works
- Order promising: the system offers a delivery date or time window based on inventory, capacity and service rules.
- Fulfillment selection: an order is assigned to the store, warehouse or local hub that can meet the promise at an acceptable cost.
- Picking and staging: items are picked, packed, labeled and staged by route or dispatch wave.
- Route planning: stops are grouped and sequenced around capacity, time windows, geography and driver constraints.
- Dispatch and execution: drivers receive assignments, navigation and customer instructions through a delivery app.
- Proof of delivery: the system records time, location, signature, photo or other approved evidence.
- Exception and returns handling: failed attempts, refusals, damages and returns follow defined workflows.
For ultra-fast models, local inventory placement and picking speed become especially important. See our guide to the quick-commerce supply chain.
The Main Last-Mile Cost Drivers
| Cost driver | Operational effect |
|---|---|
| Low stop density | More travel time and miles per delivery |
| Failed delivery attempts | Repeat handling, extra miles and delayed revenue recognition |
| Narrow time windows | Lower route flexibility and vehicle utilization |
| Long service time | Fewer completed stops per route |
| Poor address data | Navigation errors, calls and exceptions |
| Split shipments | Multiple deliveries for one customer order |
| Vehicle mismatch | Unused capacity or inability to serve the stop |
| Returns and refusals | Reverse-logistics cost and additional handling |
12 Last-Mile Delivery KPIs
1. On-Time Delivery Rate
On-time delivery rate = Deliveries completed within promise ÷ Total completed deliveries × 100
2. First-Attempt Delivery Success
First-attempt success = Successful first-attempt deliveries ÷ Total deliveries attempted for the first time × 100. This is one of the highest-leverage last-mile KPIs because a failed first attempt creates re-delivery cost, delay and additional customer contact. Segment failures by address quality, customer availability, access, payment, capacity and other reason codes rather than relying on one blended rate.
3. Cost per Successful Delivery
Cost per successful delivery = Total last-mile operating cost ÷ Successful deliveries. Include driver labor, vehicle ownership or contractor charges, fuel or energy, maintenance, technology, dispatch/support overhead and reattempt costs. Use successful deliveries—not raw attempts—as the denominator so failed-delivery cost is visible rather than hidden.
4. Stops per Route
This shows route productivity but should be read alongside route duration, distance, package mix and service time. A high stop count is not automatically efficient if failures or overtime rise.
5. Deliveries per Driver Hour
Measure successful deliveries divided by paid or active driver hours using a consistent definition. Avoid creating unsafe incentives around speed.
6. Miles per Successful Delivery
This connects routing efficiency with delivery success. Track planned versus actual miles to identify detours, sequencing issues and poor geographic clustering.
7. Average Service Time per Stop
Service time covers arrival through departure. Segment it by residential, business, apartment, locker, signature requirement and item type.
8. Route Completion Rate
Route completion rate = Stops completed ÷ Stops assigned × 100. Unfinished routes may indicate overplanning, late dispatch, vehicle issues or unrealistic service assumptions.
9. Delivery Window Accuracy
Compare actual arrival time with the communicated estimated window. This measures customer-promise quality, not only internal schedule compliance.
10. Exception Rate
Track address errors, access failures, damages, missing packages, refusals, vehicle breakdowns and app failures separately. A single combined rate can hide the real cause.
11. Customer Contact Rate
Calls or messages per delivery reveal whether instructions, notifications and delivery estimates are clear. Interpret the metric with customer satisfaction rather than treating all contact as waste.
12. Emissions or Energy per Delivery
For sustainability reporting, measure fuel, electricity or estimated emissions per successful delivery. Vehicle type, load, route density and local electricity mix all affect the result.
Last-Mile Delivery Optimization Strategies
Improve Address and Delivery Data
Validate addresses before dispatch and capture building access, preferred drop location, contact method and delivery restrictions. Better master data prevents avoidable driver calls and failed attempts.
Increase Stop Density
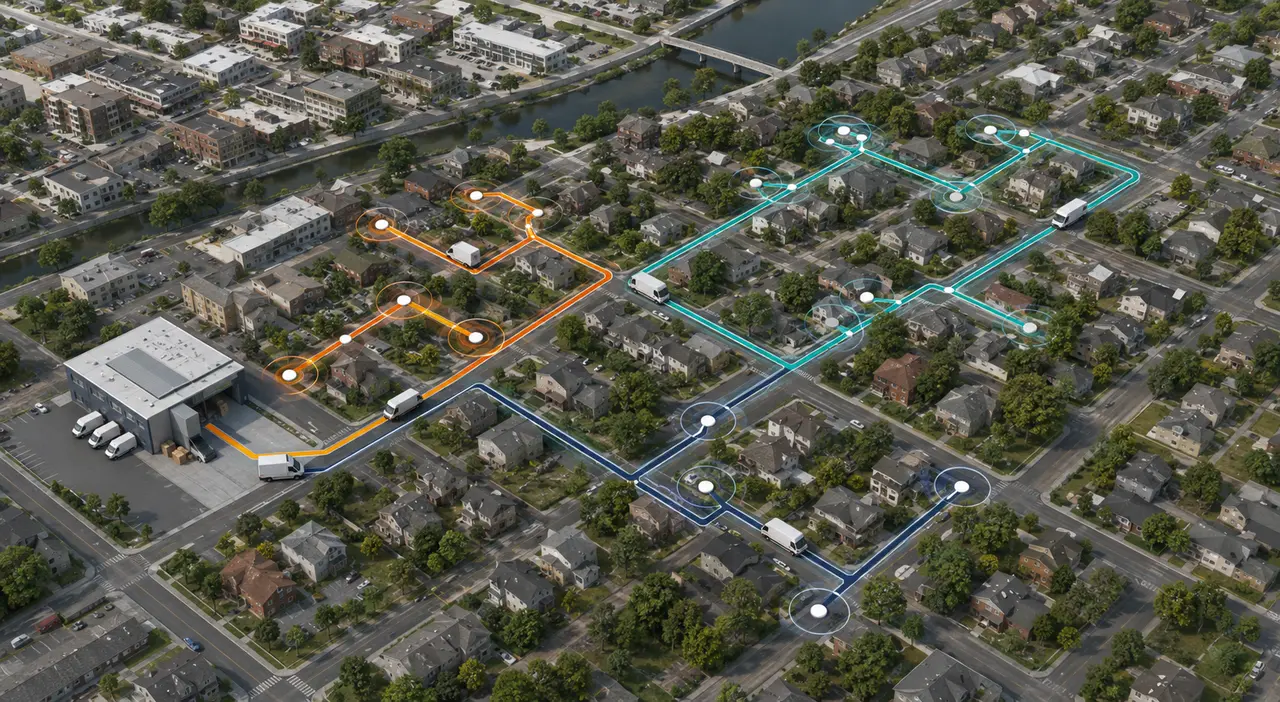
Cluster orders geographically, use appropriate delivery days, consolidate orders and consider pickup points or lockers where they fit the customer proposition. Density often matters more than raw distance.
Use Dynamic Route Optimization
Route optimization should account for time windows, capacity, service time, traffic, driver rules and priority—not distance alone. Dynamic systems can replan when new orders, delays or cancellations occur. UPS reports using AI and machine learning to improve routing and reduce miles driven, illustrating the value of continuous route refinement at scale.
Align Fulfillment With Delivery Cost
The closest inventory location is not always the lowest-cost option. Order promising should consider inventory availability, pick capacity, cutoff time, split-shipment risk, carrier options and last-mile route economics.
Inventory placement also affects delivery density and speed. See our guide to inventory optimization in supply chain.
Reduce Failed Attempts
Send accurate notifications, allow customers to update instructions, use proof-of-delivery controls and offer alternative delivery locations where appropriate. Analyze failure reasons by area and customer type.
Design Better Dispatch Waves
Coordinate pick completion, staging space, driver arrival and route departure. Releasing routes too early creates incomplete loads; releasing too late reduces delivery capacity.
What Should a Last-Mile Delivery App Include?
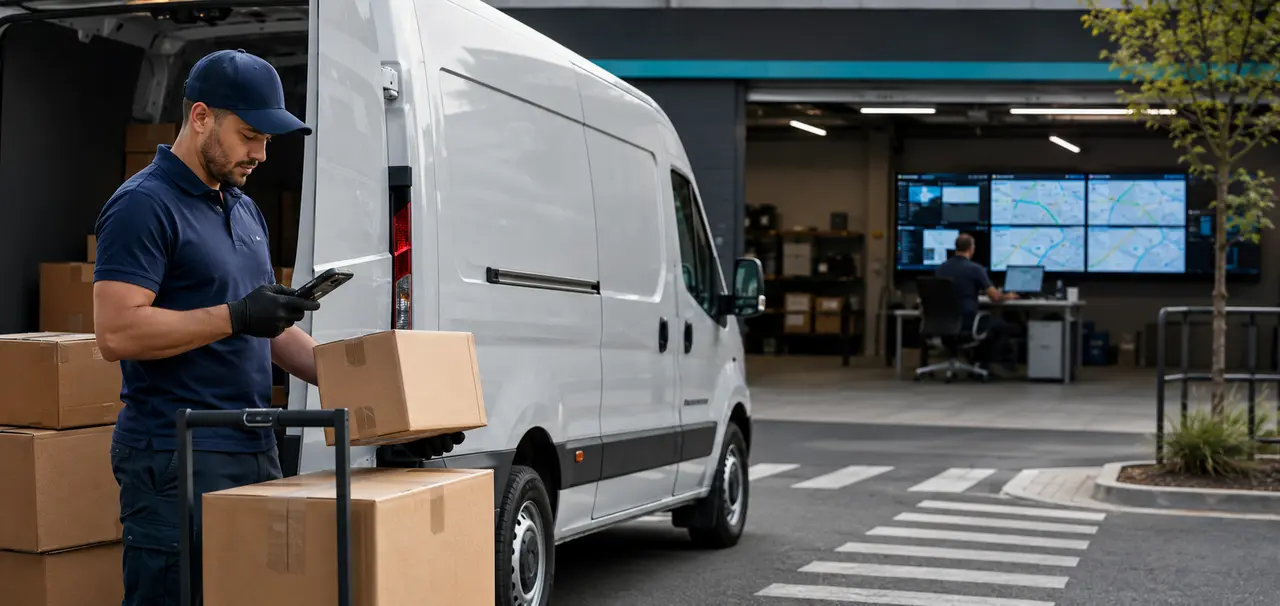
A last-mile delivery app is the operating interface between dispatch and the driver. Useful capabilities include:
- Route sequence and turn-by-turn navigation
- Package scanning and load verification
- Customer instructions and secure communication
- Proof of delivery with time and location controls
- Exception codes and guided recovery workflows
- Real-time dispatch updates
- Offline capability for weak-coverage areas
- Driver safety and privacy controls
The app should reduce driver decisions and duplicate entry without creating distraction. IBM describes modern dispatch systems as combining assignment, routing, GPS visibility, mobile access, communication and operational reporting.
AI in Last-Mile Delivery
AI can estimate service time, predict failed-delivery risk, recommend route changes, forecast volume and match orders with delivery capacity. The model should support a defined decision and be monitored for drift, bias and operational exceptions. Learn more about AI in supply chain management.
Sustainable Last-Mile Delivery
Reducing unnecessary miles is usually the first sustainability lever because it can improve both cost and emissions. Additional options include electric delivery vehicles, cargo bikes, micro-hubs, lockers and better load consolidation. The U.S. Department of Energy’s Alternative Fuels Data Center notes that electric vehicles can reduce fuel costs and air-quality impacts, while actual lifecycle benefits depend partly on the electricity source.
A Practical Improvement Roadmap
- Define the service promise: clarify delivery windows, geographic coverage and eligible products.
- Establish a baseline: measure cost, success, miles, service time and exceptions using consistent definitions.
- Segment the operation: separate urban, suburban, rural, residential, business, scheduled and same-day flows.
- Identify the primary loss: determine whether cost comes mainly from distance, low density, service time, failure, staging or capacity mismatch.
- Pilot one intervention: test revised routes, address validation, new delivery windows or a software feature in a bounded area.
- Measure end-to-end impact: verify service, cost, safety, customer and workforce outcomes.
- Scale with controls: define ownership, exception handling, driver feedback and ongoing KPI review.
Common Optimization Mistakes
- Optimizing route distance while ignoring service time and failed attempts.
- Using averages without separating geography and customer type.
- Promising delivery windows without confirmed inventory and capacity.
- Tracking attempted stops instead of successful deliveries.
- Deploying a driver app without involving drivers in workflow design.
- Increasing speed through incentives that create safety risks.
- Ignoring returns and reverse-logistics cost.
Frequently Asked Questions
What is last-mile delivery optimization?
It is the improvement of fulfillment selection, routing, dispatch, delivery execution and exception handling to achieve reliable customer service at the lowest sustainable total cost.
What is the most important last-mile KPI?
No single KPI is sufficient. Cost per successful delivery should be balanced with on-time delivery, first-attempt success, safety and customer outcomes.
How does route optimization reduce delivery costs?
It groups and sequences stops around geography, time windows, capacity and service constraints, reducing avoidable miles, overtime and uncompleted routes.
What is the difference between last mile and final mile?
The terms are often used interchangeably. “Final mile” is common for bulky goods and scheduled home delivery, while “last mile” is widely used across parcel, grocery and e-commerce operations.
Conclusion
Last-mile delivery optimization requires more than a routing algorithm. Inventory availability, fulfillment timing, address quality, customer communication, route density, driver workflow and exception handling all influence the cost of a successful delivery.
Start with reliable KPI definitions, identify the largest operational loss and test one improvement in a controlled area. The strongest programs balance cost, service, safety and sustainability instead of optimizing one metric in isolation.
Authoritative references: U.S. DOT: How We Move Things; U.S. DOE: Freight and Last-Mile Delivery; IBM: Dispatch Management; and UPS: Sustainable Logistics and Route Optimization.


2 Comments