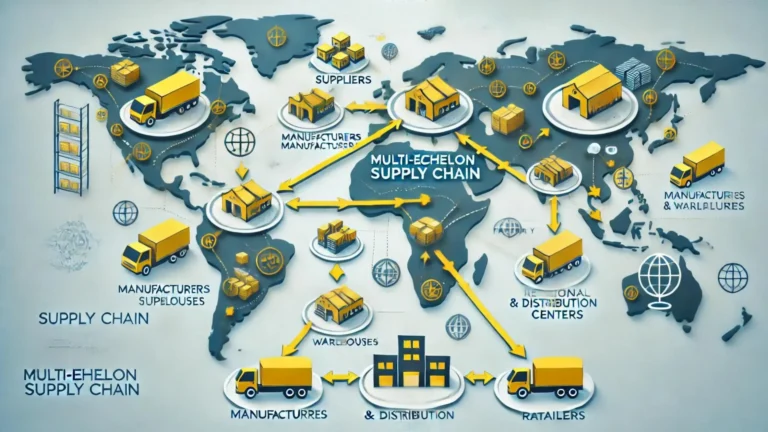
The most important areas of interest in supply chain analytics are not defined by market-size forecasts or technology hype. They are defined by the decisions an organization needs to improve: what to buy, produce, position, move, promise, protect and measure. This guide explains ten high-value analytics areas, the questions they address, the data they require and the controls needed to use them responsibly.

How to Evaluate an Analytics Priority
A capability deserves investment when it improves a defined decision or control. Before choosing a tool or model, clarify:
- Decision: What action will change because of the analysis?
- Owner: Who is accountable for interpreting and acting on the result?
- Frequency: How often must the decision be made?
- Value: What service, cost, quality, cash or risk outcome could improve?
- Data: Are the required records timely, complete and consistently defined?
- Control: What review, override, audit trail and fallback are required?
1. Demand Forecasting and Demand Sensing
Forecasting estimates future demand over an agreed item, location and time horizon. Demand sensing uses more recent signals to update a near-term view. The right method depends on demand history, intermittency, seasonality, promotions, product life cycle and decision horizon.
- Decisions supported: Purchasing, production, capacity, labor and deployment.
- Data required: Historical demand, stockouts, promotions, price, calendar and product attributes.
- Measures: Forecast bias, MAE, WAPE or another consistently defined error metric.
- Risk: Treating a statistical forecast as a commitment without accounting for constraints or known events.
Try the Moving Average Forecast Calculator to understand a simple baseline method.
2. Inventory and Replenishment Analytics
Inventory analytics connects demand, lead time, service policy, order quantity, supply reliability and item economics. The goal is not simply to minimize stock; it is to make the reason for each inventory position explicit and manage the trade-off between availability, working capital and risk.
- Decisions supported: Safety stock, reorder points, review frequency, allocation and excess-stock action.
- Data required: Demand, lead time, receipts, stock status, unit cost, pack size and service requirements.
- Measures: Availability, days of supply, inventory turns, stockout frequency and aged stock.
- Risk: Applying one policy to items with different value, criticality and variability.
Use the ABC Analysis Calculator and Safety Stock and Reorder Point Calculator to examine segmentation and replenishment assumptions.
3. Real-Time Visibility and Exception Management
Visibility analytics combines events from orders, inventory, facilities, carriers and connected assets to show current status. Its operational value comes from exception management: identifying which event needs attention, who owns it and how quickly action is required.
- Decisions supported: Shipment intervention, customer communication, expediting and inventory reallocation.
- Data required: Standard identifiers, timestamps, locations, status events and partner updates.
- Measures: Data latency, event completeness, alert precision, response time and exception closure.
- Risk: Creating many alerts without prioritization or ownership.
GS1’s EPCIS standard supports the sharing of supply chain visibility events using a common language, helping partners describe the what, where, when, why and how of products and assets.
4. Supply Chain Risk and Resilience Analytics
Risk analytics maps products, sites, suppliers, sub-tier dependencies, transport lanes and critical resources. It helps teams identify concentration, single points of failure and exposure to disruption before an incident occurs.
- Decisions supported: Supplier qualification, dual sourcing, buffer policies, recovery priorities and scenario planning.
- Data required: Bills of material, supplier and site relationships, capacity, lead time, geography and recovery information.
- Measures: Time to detect, time to recover, revenue or service at risk and mitigation completion.
- Risk: Assigning a risk score without documenting evidence, assumptions or action thresholds.
NIST recommends supply chain mapping as a way to identify dependencies, risks and improvement priorities across the wider network.
5. Transportation and Last-Mile Analytics
Transportation analytics evaluates routing, consolidation, carrier performance, network design, delivery promises and asset utilization. Last-mile analytics adds address quality, delivery density, service windows, attempt outcomes and customer communication.
- Decisions supported: Carrier selection, route planning, load building, delivery sequencing and network configuration.
- Data required: Orders, lanes, rates, capacity, service windows, scans, distance and actual delivery outcomes.
- Measures: Cost per shipment, on-time delivery, utilization, empty distance and first-attempt success.
- Risk: Optimizing cost while ignoring service, safety or realistic operating constraints.
See our guide to last-mile delivery optimization and KPIs.
6. Warehouse and Fulfillment Analytics
Fulfillment analytics examines receiving, putaway, storage, replenishment, picking, packing, shipping and returns. It can reveal where capacity, queueing, travel, quality or labor allocation constrains flow.
- Decisions supported: Slotting, labor planning, wave design, replenishment timing and automation selection.
- Data required: Task timestamps, locations, order lines, item dimensions, inventory, labor and equipment events.
- Measures: Dock-to-stock time, pick rate, order cycle time, first-pass quality and backlog age.
- Risk: Comparing productivity without accounting for order complexity, travel or quality.
7. AI-Assisted Decision Support
AI can support forecasting, anomaly detection, inventory classification, estimated arrival times, scheduling and natural-language access to operational information. The analytical opportunity is significant, but models should be governed as decision systems—not treated as neutral or automatically correct.
- Decisions supported: Prioritization, prediction, recommendation and exception triage.
- Data required: Representative training and evaluation data, outcome labels and documented lineage.
- Measures: Accuracy appropriate to the use case, false alerts, drift, overrides and operational outcome.
- Risk: Model failure under changed conditions, weak explainability, insecure data or uncontrolled automation.
The NIST AI Risk Management Framework organizes responsible AI activity around governance, context mapping, measurement and ongoing risk management.
8. Digital Twins and Scenario Simulation
Simulation models test how a system may behave under alternative assumptions. A digital twin connects a model to information about a physical system or process. In supply chains, these approaches can examine capacity, inventory positioning, network choices and disruption scenarios before physical changes are made.
- Decisions supported: Capacity changes, facility configuration, policy testing and contingency planning.
- Data required: Process logic, demand, capacity, time, constraints, costs and validation observations.
- Measures: Model error, scenario sensitivity, decision impact and assumption stability.
- Risk: Presenting a detailed model as reality without validating its scope and assumptions.
Read more about digital twins in supply chain analytics.
9. Sustainability and Value-Chain Emissions Analytics
Sustainability analytics can quantify energy, materials, waste, transport and value-chain emissions. The GHG Protocol Corporate Value Chain Standard provides a methodology for accounting and reporting Scope 3 emissions across upstream and downstream categories.
- Decisions supported: Supplier engagement, mode selection, network changes, packaging and reduction priorities.
- Data required: Activity data, supplier information, emission factors, spend or product data and methodology records.
- Measures: Emissions by category, activity intensity, data quality and reduction progress.
- Risk: Mixing estimates and primary data without documenting calculation methods and limitations.
10. Responsible Sourcing and Due-Diligence Analytics
Responsible-sourcing analytics helps organizations identify and prioritize potential adverse impacts involving workers, human rights, the environment, bribery, consumers and governance across operations and business relationships. The OECD describes due diligence as a risk-based process for assessing and addressing actual and potential negative impacts.
- Decisions supported: Supplier screening, audit planning, remediation, escalation and sourcing approval.
- Data required: Supplier ownership, site location, category risk, audit findings, grievances and corrective actions.
- Measures: Coverage of risk-based assessments, overdue actions, recurrence and verified remediation.
- Risk: Treating a supplier score as proof of compliance without investigation or stakeholder input.
Cross-Cutting Foundations
| Foundation | Why it matters | Minimum practice |
|---|---|---|
| Master data | Models cannot correct inconsistent items, locations, units or partners automatically. | Ownership, standards, validation and change control |
| Interoperability | Partners and systems must interpret events consistently. | Defined identifiers, schemas, APIs and event rules |
| Data quality | Missing or delayed records weaken decisions. | Completeness, timeliness, accuracy and lineage checks |
| Governance | Analytics affects operational and financial decisions. | Owners, approval limits, audit trails and escalation |
| Cybersecurity | Connected systems create new dependencies and exposure. | Access control, asset inventory, monitoring and recovery |
| Adoption | A technically correct model creates no value if teams cannot use it. | User involvement, training, feedback and usage measures |
A Practical Prioritization Matrix
Score each proposed use case from 1 to 5 on business value, decision frequency, data readiness, implementation effort and risk. Do not simply add the scores: use them to expose trade-offs. A high-value use case with weak data may require a data-quality project before predictive modeling. A lower-complexity visibility use case may create faster learning and a stronger foundation.
| Question | High-priority signal | Caution signal |
|---|---|---|
| Is the decision clearly defined? | Named action, owner and cadence | General desire for “insights” |
| Can value be measured? | Documented baseline and outcome | No agreed success measure |
| Is data usable? | Available, governed and timely | Manual, inconsistent or inaccessible |
| Can the result be acted upon? | Process and authority exist | No owner or execution path |
| Is risk controlled? | Review, fallback and monitoring defined | Uncontrolled automation or opaque model |
Implementation Roadmap
- Select the operational decision and define the current problem.
- Establish the baseline for service, cost, time, quality or risk.
- Map required data, its owners, definitions and known limitations.
- Build a simple benchmark before choosing a complex model.
- Pilot with users and retain human review for material decisions.
- Measure outcomes and failure modes, including overrides and workarounds.
- Standardize and scale only after the capability is stable and controlled.
Skills Behind These Analytics Areas
- Supply chain process knowledge and operational problem framing
- Data extraction, cleaning and master-data understanding
- Statistics, forecasting and optimization fundamentals
- Dashboard design and decision-oriented communication
- Experimentation, model evaluation and root-cause analysis
- Data governance, cybersecurity and responsible AI awareness
- Change management and cross-functional execution
Frequently Asked Questions
Which supply chain analytics area should a company start with?
Start with a frequent, high-value decision that has an accountable owner and usable data. Inventory, forecasting, fulfillment visibility or supplier performance are common starting points, but the best choice depends on the organization’s actual constraint.
Is artificial intelligence always the highest-value priority?
No. Standard definitions, reliable master data, descriptive reporting or a simple baseline model may create more value when the underlying process is not controlled. AI should be selected for a defined use case and evaluated against a simpler alternative.
How should analytics value be measured?
Compare the agreed operational baseline with the result after implementation. Include service, cost, time, quality, adoption and risk measures, and check whether the problem was shifted to another process.
Conclusion
The highest-value areas of interest in supply chain analytics connect data to a specific operational decision. Forecasting, inventory, visibility, resilience, logistics, fulfillment, AI, digital twins, sustainability and responsible sourcing all require different data and controls. Prioritize the decision first, build the foundation, test against a baseline and scale only when the outcome is measurable and repeatable.
Authoritative References
- NIST: Mapping Supply Chains to Prioritize Risks and Actions
- NIST: Artificial Intelligence Risk Management Framework
- GS1: EPCIS Supply Chain Visibility Standard
- NIST: Digital Twin Economics
- GHG Protocol: Corporate Value Chain Scope 3 Standard
- GHG Protocol: Scope 3 Calculation Guidance
- OECD: Due Diligence for Responsible Business Conduct