
Introduction
Ensuring consistent coffee quality is a top priority for businesses operating within the global supply chain. The Coffee Quality Institute (CQI) has released a detailed dataset that covers key factors like sensory evaluations, defect counts, and processing methods. By utilizing data analytics tools like Power BI, businesses can gain insights into what drives coffee quality and optimize their supply chain operations—enhancing production, distribution, and quality control processes.
Objectives
The primary goals of this project are:
- To identify the key determinants of coffee quality as evaluated through sensory attributes such as aroma, flavor, and acidity.
- To explore the correlation between processing methods, origin regions, and coffee quality scores.
- To identify trends or patterns in defect occurrences and their impact on overall coffee quality.
- To analyze how different variables interact to influence the Total Cup Points, an overall measure of coffee quality.
Data Overview of Coffee Quality Data from CQI
The Coffee Quality Data from CQI includes various features such as:
- Sensory Evaluations: Aroma, Flavor, Aftertaste, Acidity, Body, Balance, Uniformity, Clean Cup, Sweetness.
- Defects: Category One (visual defects) and Category Two (taste defects).
- Processing Methods: Washed/Wet, Natural/Dry, Pulped Natural/Honey, etc.
- Origin Information: Country of origin, harvest year, and coffee variety.
Power Bi Dashboard – Coffee Quality Dataset
Global Coffee Quality Analysis: Evaluating Coffee Origins, Attributes, and Quality Scores
Discover a deep dive into global coffee quality, exploring origins, attributes, and quality scores. This analysis sheds light on what makes your coffee experience exceptional around the world!
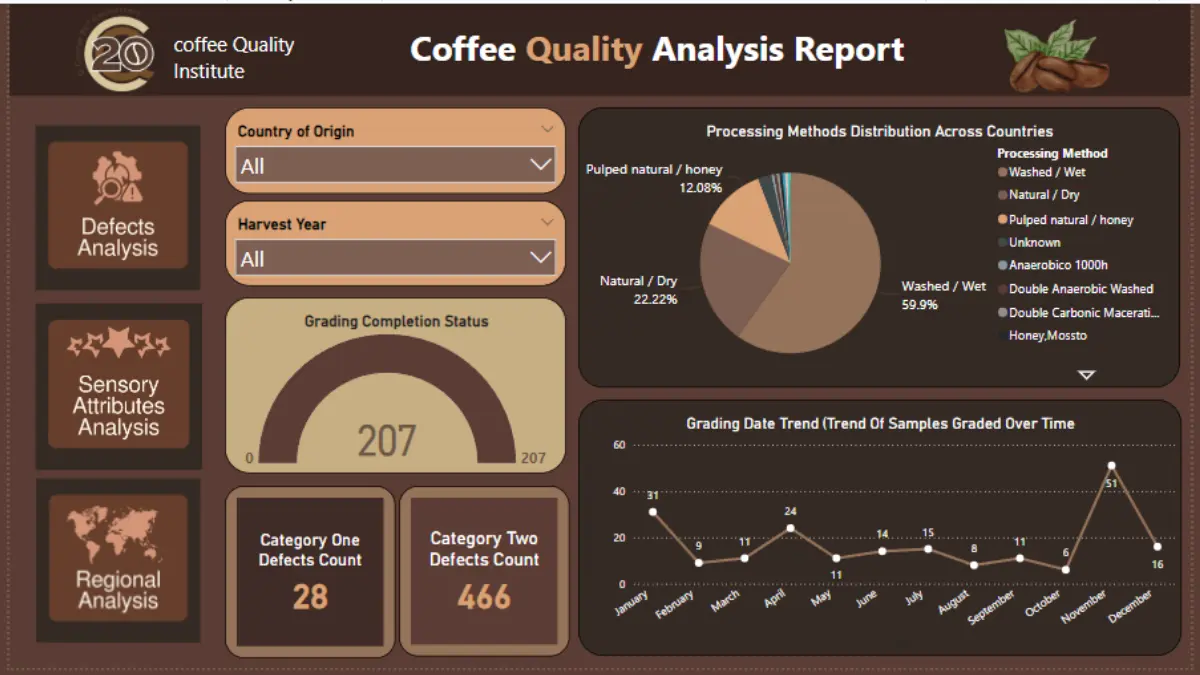
Processing Methods Distribution Across Countries
The first graph in our Power BI dashboard illustrates the distribution of different coffee processing methods across countries. The dominant processing method is “Washed/Wet,” accounting for 61.39%, followed by “Natural/Dry” at 22.77%, and “Pulped Natural/Honey” at 12.38%.
This distribution highlights the prevalent techniques used in coffee processing, which can significantly influence the flavor profile and quality of the coffee. Understanding the geographical preferences for processing methods helps in identifying regional specialties and potential areas for quality improvement.
Grading Date Trend
The trend of samples graded over time reveals fluctuations in the number of coffee samples evaluated each month. Notably, the peak grading month is November, with 51 samples graded, followed by January with 31 samples, and April with 24 samples. This trend indicates a seasonality in coffee production and grading activities, which could be linked to harvest cycles and market demands.
Grading Completion Status
Out of the total samples graded, all 207 have completed the grading process. This status update ensures that the evaluation process is on track and helps in identifying any bottlenecks in the grading pipeline.
Category One and Two Defects Count
Defects play a crucial role in determining the overall coffee quality. The dashboard shows 28 instances of Category One defects and 466 instances of Category Two defects. Category One defects are more severe and visually identifiable, whereas Category Two defects are subtle and detected through tasting.
Distribution of Defects by Country
In the Coffee Quality Data the distribution of Category One and Two defects across countries reveals that Brazil, Colombia, and Ethiopia have higher counts of defects compared to other regions. This information is vital for stakeholders to address quality control issues and implement corrective measures in specific regions.
Impact of Defects on Total Cup Points
An analysis of how defects impact the Total Cup Points across different processing methods shows that certain methods like “Double Anaerobic Washed” and “Honey, Mossto” have higher average scores despite the presence of defects. This suggests that some processing methods might mitigate the negative effects of defects better than others.
Heatmap: Processing Method vs. Total Cup Points & Sensory Attributes
A heatmap comparing processing methods against sensory attributes and Total Cup Points highlights the superior performance of “Double Anaerobic Washed” and “Honey, Mossto” methods. These methods consistently achieve higher scores across all sensory attributes, indicating their effectiveness in enhancing coffee quality.
Variety Distribution by Country of Origin
The variety distribution chart shows the diversity of coffee varieties across different countries. Colombia, Guatemala, and Brazil have a wide range of coffee varieties, which contributes to the rich flavor profiles and high-quality scores from these regions.
Production of Coffee Beans by Country of Origin
The production volume of coffee beans by country highlights Guatemala, Brazil, and Colombia as the top producers. This metric provides insights into the scale of coffee production and helps in understanding the supply dynamics in the global coffee market.
Comparison of Average Quality Score per KG by Country of Origin
A comparison of the average quality score per kilogram of coffee by country reveals that Ethiopia and Taiwan have the highest average scores, indicating superior coffee quality from these regions. This finding aligns with the sensory evaluation results, confirming the high standards of coffee produced in these countries.
Key Findings and Insights from Coffee Quality Data
Processing Methods and Quality
The “Double Anaerobic Washed” and “Honey, Mossto” processing methods consistently produce high-quality coffee, as evidenced by their high scores across all sensory attributes. These methods should be explored further and potentially adopted in other regions to enhance coffee quality.
Defects Impact
While defects negatively impact coffee quality, certain processing methods can mitigate these effects. Stakeholders should focus on improving processing techniques to reduce the occurrence of defects and enhance overall quality.
Regional Quality Trends
Ethiopia and Taiwan stand out for their high average quality scores, suggesting that these regions have optimized their production and processing methods. Other countries can learn from their practices to improve their coffee quality.
Seasonality in Grading
The seasonal trends in grading highlight the importance of timing in the coffee production and evaluation process. Aligning production cycles with peak grading periods can ensure timely evaluation and market readiness.
Diversity in Coffee Varieties
The wide range of coffee varieties in Colombia, Guatemala, and Brazil contributes to their high-quality scores. Promoting varietal diversity in other regions can enhance flavor profiles and meet diverse consumer preferences.
Suggestions for Future Research
- Processing Method Optimization: Further research into the specific steps and conditions of high-performing processing methods like “Double Anaerobic Washed” can provide detailed guidelines for producers looking to adopt these techniques.
- Defect Reduction Strategies: Investigating the root causes of defects and developing targeted interventions can help reduce the incidence of defects and improve overall coffee quality.
- Consumer Preferences: Understanding consumer preferences for different sensory attributes can help producers tailor their products to meet market demands, thereby increasing satisfaction and market share.
- Sustainability Practices: Exploring the relationship between sustainable farming practices and coffee quality can highlight the benefits of environmentally friendly methods, encouraging wider adoption.
Conclusion
This data analytics project, using Power BI, uncovers valuable insights into the factors that drive coffee quality, from processing methods to defect management. By focusing on these key variables, businesses can make more informed decisions that enhance coffee quality and streamline their supply chains. The findings from this analysis offer a clear path forward for improving quality control and operational efficiency in the global coffee market.


Great Analysis . But I think the heat map for variety analysis seems not right. It simply represent variety row count of that country . I suppose distinct count should be used to give right info on variety